Visual insight into CI environments
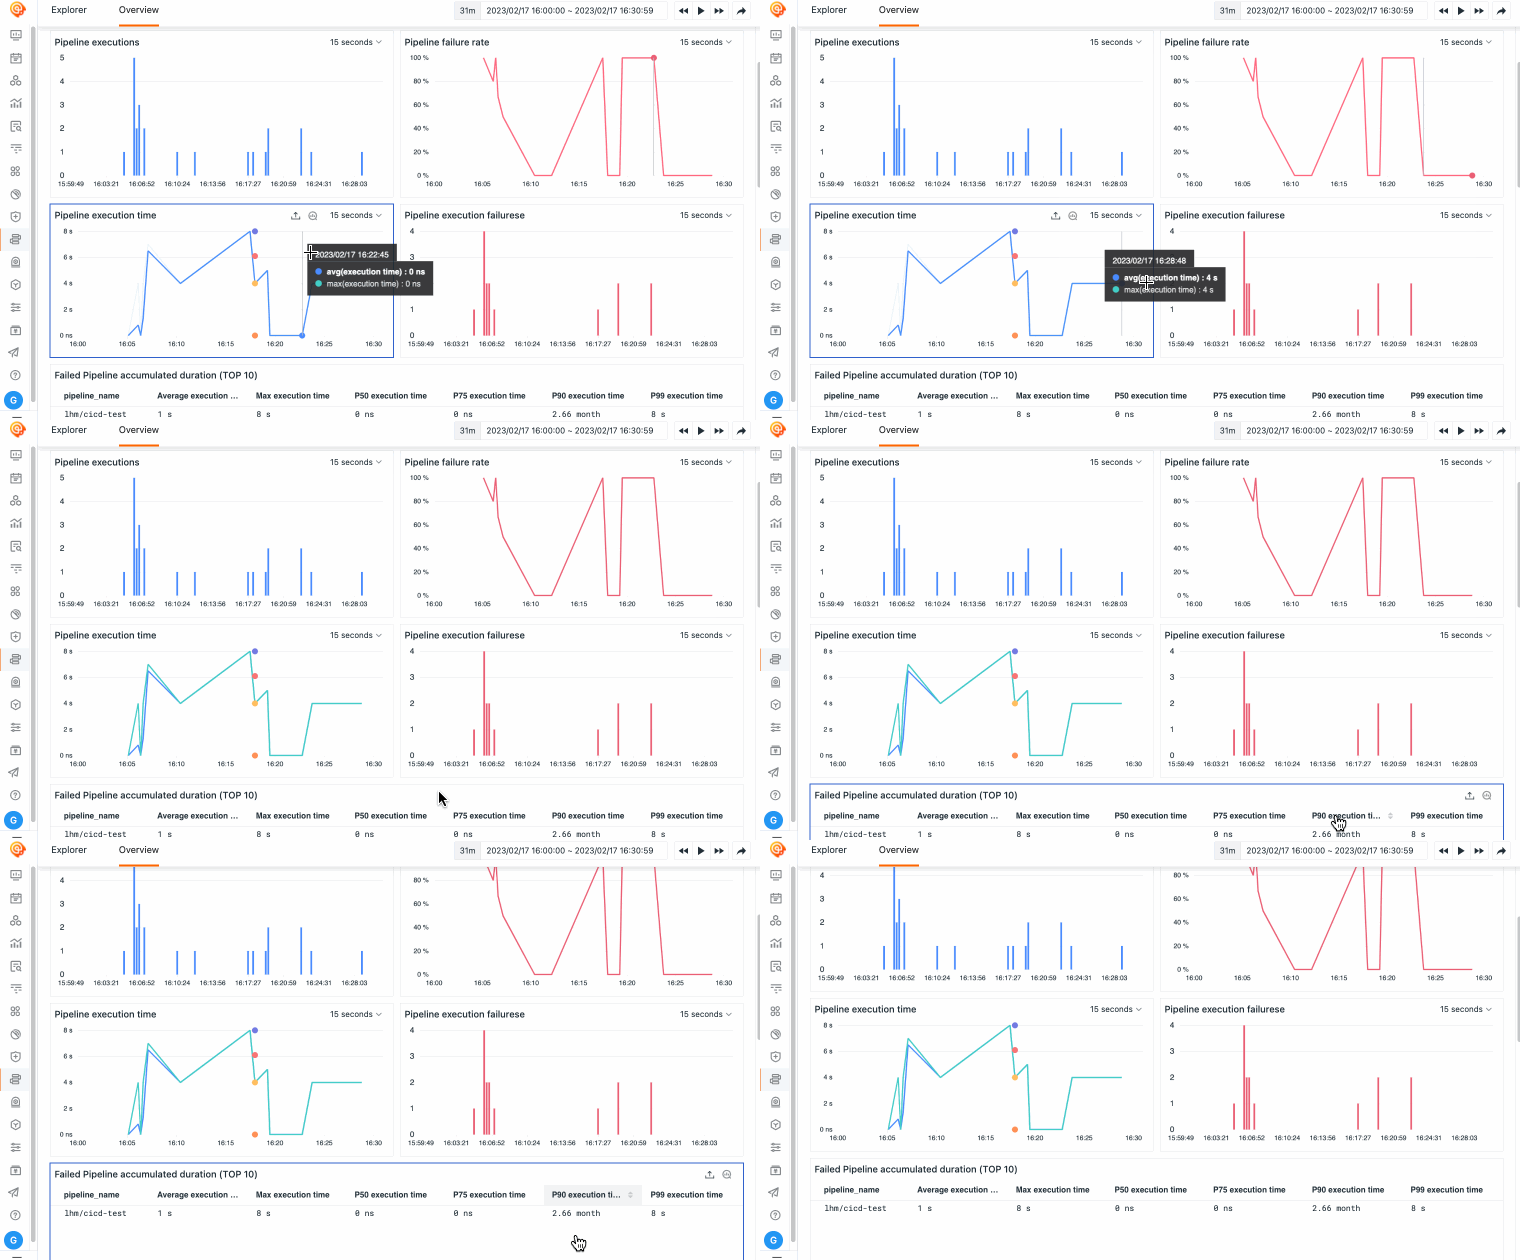
We brings together data about CI performance, trends and reliability in one place, with links to customisable dashboards that support real-time monitoring of CI execution numbers, health, performance trends and more, based on a visual, fully observable approach.


In-depth tracking of problematic pipelines and tasks
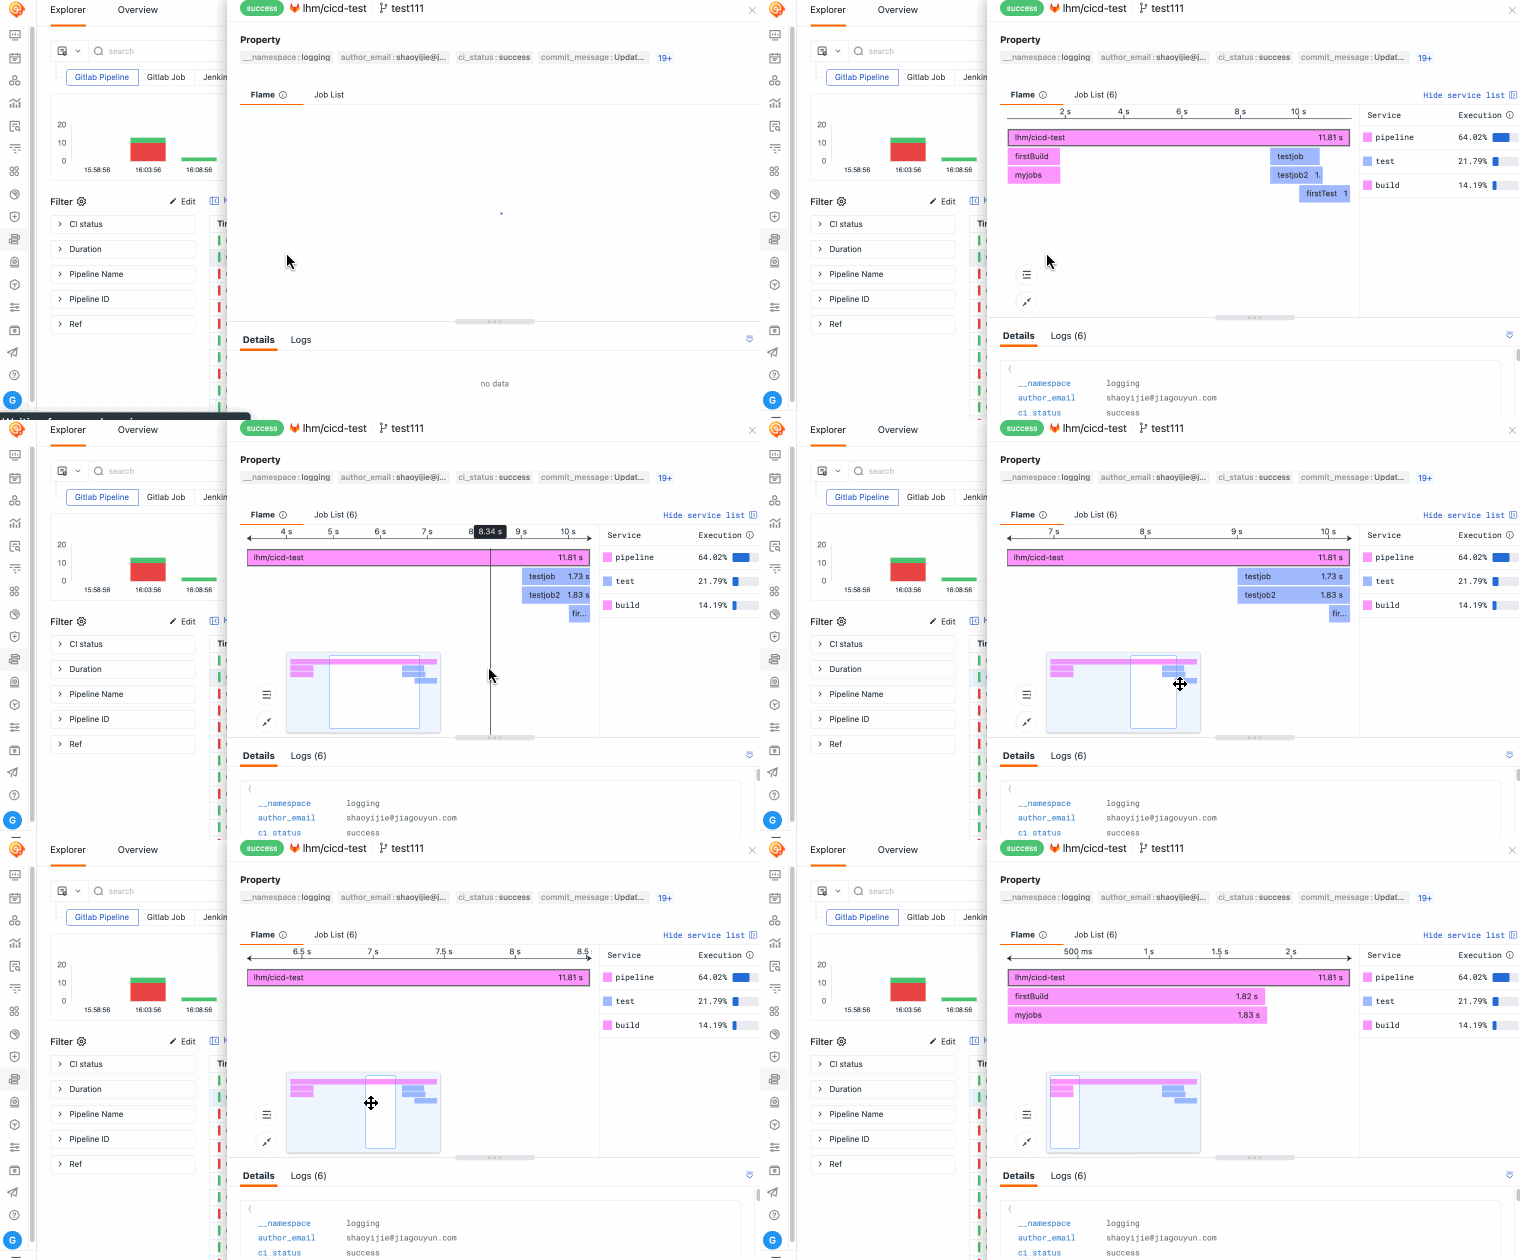
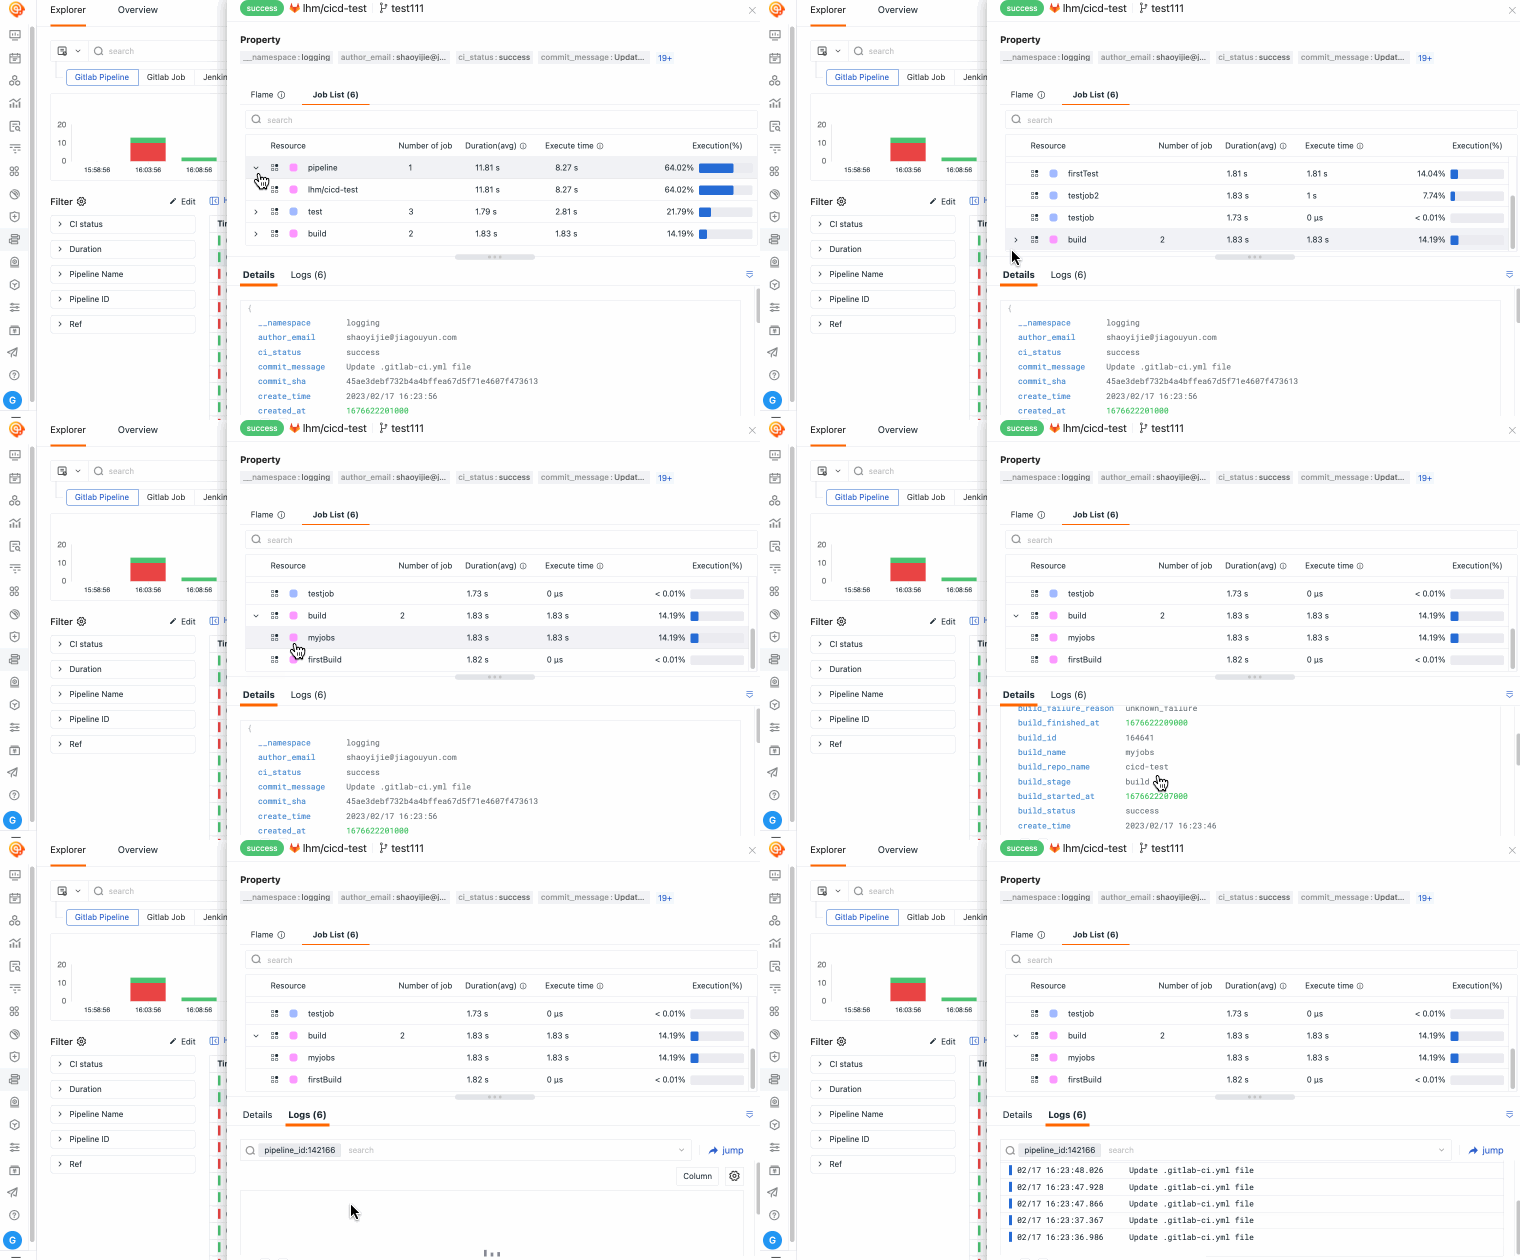
The CI visual explorer provides detailed information on pipelines and jobs, recording the run, duration, results, failure rate, etc. of each pipeline, stage, job in a time-dimensional manner, and provides insight into user experience and satisfaction through automated exception detection and in-depth tracking of problematic pipeline/UV accesses.
Quickly resolve exceptions
By correlating and tracing exceptions based on contextual data such as error sources, task call spans and logs, and by quickly searching profiles with yaml tags to quickly and accurately target code scope, CI visualisation saves time on tedious and complex issue tracing, allowing engineers to focus on tags such as code quality/region to identify the propensity for groups of errors to occur.
